Product Line
Showing 37–40 of 171 results
-
Sale!
CMA Review Ultimate Pass: Upgrade (Essentials)
CMA Review Features – Ultimate
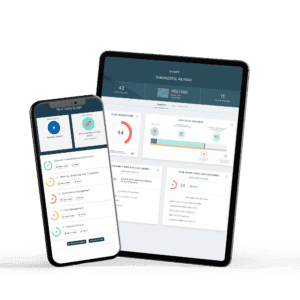
- Proprietary Predictive AI Technology
- ReadySCORE
- 3,900+ Multiple-choice questions – with full text answers!
- 65 Essay Problems
- Unlimited practice exams
- Desktop, Tablet, & Mobile Compatible
- Study Companion App
- Reference Ebooks Included
- Free Automatic Content Updates
- Pass or Money-Back Guarantee
- 1 on 1 Virtual Coaching Sessions
- 60+ Video Lectures
- Audio Lectures for all Exam Sections
- Printed Flashcards
- Printed Reference Books
- Unlimited Course Access Until You PASS
-
CMA Review Ultimate Pass: Upgrade (Premier)
BEST FOR STUDENTS LOOKING TO KICK-START THEIR CAREER AS A CERTIFIED MANAGEMENT ACCOUNTANT ONCE THEY PASS THEIR EXAM
Surgent CMA Review provides unlimited full-course access to the only truly adaptive CMA prep course on the market. Surgent’s course utilizes Proprietary Predictive AI Technology to provide the most effective and efficient path to CMA Exam success. As you study, Surgent’s unique ReadySCORE™ feature updates in real time to show you how exam-ready you are. All content is IMA-aligned and updated continuously.
With Surgent, you’ll only study what you need and skip what you already know, saving you hours of study time.
CMA Ultimate Pass includes 60+ video lectures, 1-on-1 virtual coaching sessions, printed flash cards and textbooks, and unlimited course access until you pass.
-
Core Data Analytics Module 1: Data Extraction and Data Sources
Course Description
This one-hour course serves as the introductory module to data analytics. Learn the basic terminology used in data analytics. This course also provides an understanding of the sources of data and importance in combining them. You will also practice the basics of Microsoft® Power Query tool
Learning Objectives
- Understand the applicable Microsoft® Excel® skills that will be required in making the transition to data analyst
- Understand the basic terminology, applications, and uses of data analytics
- Understand the relationships that exist between different sources of data
- Demonstrate the ability to perform basic Power Query functions
- Demonstrate the ability to import Excel® workbooks into Power Query
- Demonstrate the ability to connect to external data sources using Power Query
-
Core Data Analytics Module 10: Visualizations and Reporting
Course Description
This one-hour course introduces data visualization and reporting using Power BI and Microsoft® Excel®. Learn the benefits of using Power BI to create data visualizations, and see how Power BI differs from previous Excel® functions for visualizations. You will also work alongside the instructor to create a dashboard for journal entry testing. Dive into the relation among various tools for data analytics including: Power Query, Power Pivot, PivotTables, DAX formulas and storyboarding.
Learning Objectives
- Understand the applicable Excel® skills that will be required in making the transition to data analyst
- Understand what data visualization tools are available in Excel® and Power BI and how they are superior to previous Excel® tools.
- Apply skills to create a dashboard from journal entry testing data
- Apply skills to evaluate and present the output of analytical modeling in an easily interpreted form
- Learn to use the camera tool in Power BI to create dashboards