Product Line
Showing 45–48 of 322 results
-
CMA Review Ultimate Pass (Digital Only)
CMA Review Features – Ultimate
- Proprietary Predictive AI Technology
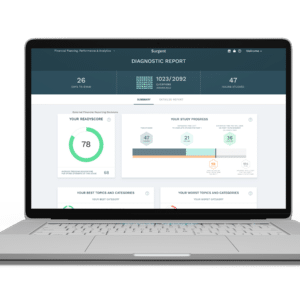
- ReadySCORE
- 3,900+ Multiple-choice questions – with full text answers!
- 65 Essay Problems
- Unlimited practice exams
- Desktop, Tablet, & Mobile Compatible
- Study Companion App
- Reference Ebooks Included
- Free Automatic Content Updates
- Pass or Money-Back Guarantee
- 1 on 1 Virtual Coaching Sessions
- 60+ Video Lectures
- Audio Lectures for all Exam Sections
- Printed Flashcards
- Printed Reference Books
- Unlimited Course Access Until You PASS
-
 Sale!
Sale!
CMA Review Ultimate Pass: Upgrade (Essentials)
CMA Review Features – Ultimate
- Proprietary Predictive AI Technology
- ReadySCORE
- 3,900+ Multiple-choice questions – with full text answers!
- 65 Essay Problems
- Unlimited practice exams
- Desktop, Tablet, & Mobile Compatible
- Study Companion App
- Reference Ebooks Included
- Free Automatic Content Updates
- Pass or Money-Back Guarantee
- 1 on 1 Virtual Coaching Sessions
- 60+ Video Lectures
- Audio Lectures for all Exam Sections
- Printed Flashcards
- Printed Reference Books
- Unlimited Course Access Until You PASS
-

CMA Review Ultimate Pass: Upgrade (Premier)
BEST FOR STUDENTS LOOKING TO KICK-START THEIR CAREER AS A CERTIFIED MANAGEMENT ACCOUNTANT ONCE THEY PASS THEIR EXAM
Surgent CMA Review provides unlimited full-course access to the only truly adaptive CMA prep course on the market. Surgent’s course utilizes Proprietary Predictive AI Technology to provide the most effective and efficient path to CMA Exam success. As you study, Surgent’s unique ReadySCORE™ feature updates in real time to show you how exam-ready you are. All content is IMA-aligned and updated continuously.
With Surgent, you’ll only study what you need and skip what you already know, saving you hours of study time.
CMA Ultimate Pass includes 60+ video lectures, 1-on-1 virtual coaching sessions, printed flash cards and textbooks, and unlimited course access until you pass.
-

Comprehensive Tax Course
$497-
Select options This product has multiple variants. The options may be chosen on the product page


